The pandemic has been horrible for most, myself included. Thankfully, there is a silver lining, and modern vaccines are presently being administered to people all over the world. In Germany, the state-run vaccination program started on the 27th of December 2020, and as of the 15th of January 2021, 1.048.160 dosages have been administered.
Germany's federal scientific institution in the field of biomedicine, the Robert Koch Institute, published this number on their website. Following this link, one can access a plain excel sheet that contains a table with two columns: the date, and the number of dosages of the Pfizer / BioNTech vaccine that have been administered that day.
| Date | Number of Vaccinations |
|---|---|
| 12.27.2020 | 24016 |
| 12.28.2020 | 19488 |
| 12.29.2020 | 42640 |
| 12.30.2020 | 57213 |
| 12.31.2020 | 37821 |
| 01.01.21 | 30483 |
| 01.02.21 | 44548 |
| 01.03.21 | 24358 |
| 01.04.21 | 48313 |
| 01.05.21 | 50352 |
| 01.06.21 | 55450 |
| 01.07.21 | 56168 |
| 01.08.21 | 57249 |
| 01.09.21 | 53428 |
| 01.10.21 | 32233 |
| 01.11.21 | 64748 |
| 01.12.21 | 79271 |
| 01.13.21 | 92557 |
| 01.14.21 | 98065 |
| 01.15.21 | 79759 |
As I'm craving a positive outlook for the future, I'll run a linear regression on this table in order to find the date when the pandemic might be over. Of course, one could argue that a linear model is unjustifiable; that Germany is not the rest of the world, and that reality is more complicated than 20 rows of data. One would be right. There's also no reason to suggest that the German authorities would be able to increase the vaccination capabilities linearly over time. All of that aside, I'd like a silver lining too, and my chosen silver lining generator is scipy.stats.linregress:
# import things, read the data, clean it up a little
# and plot a bar-chart
# [...]

# number of days since the vaccination program started
df['Days'] = (df.iloc[0, 0] - df.iloc[:, 0]).dt.days * (-1)

# run a least-squares linear regression & plot it
res = scipy.stats.linregress(x=df['Days'], y=df['# Vaccinations'])
plt.plot(x.values, res.intercept + res.slope*x.values, 'r', label='fitted line')
Straightforward enough, isn't it? Here's what the resulting bar chart looks like - the solid red line representing the regression result:
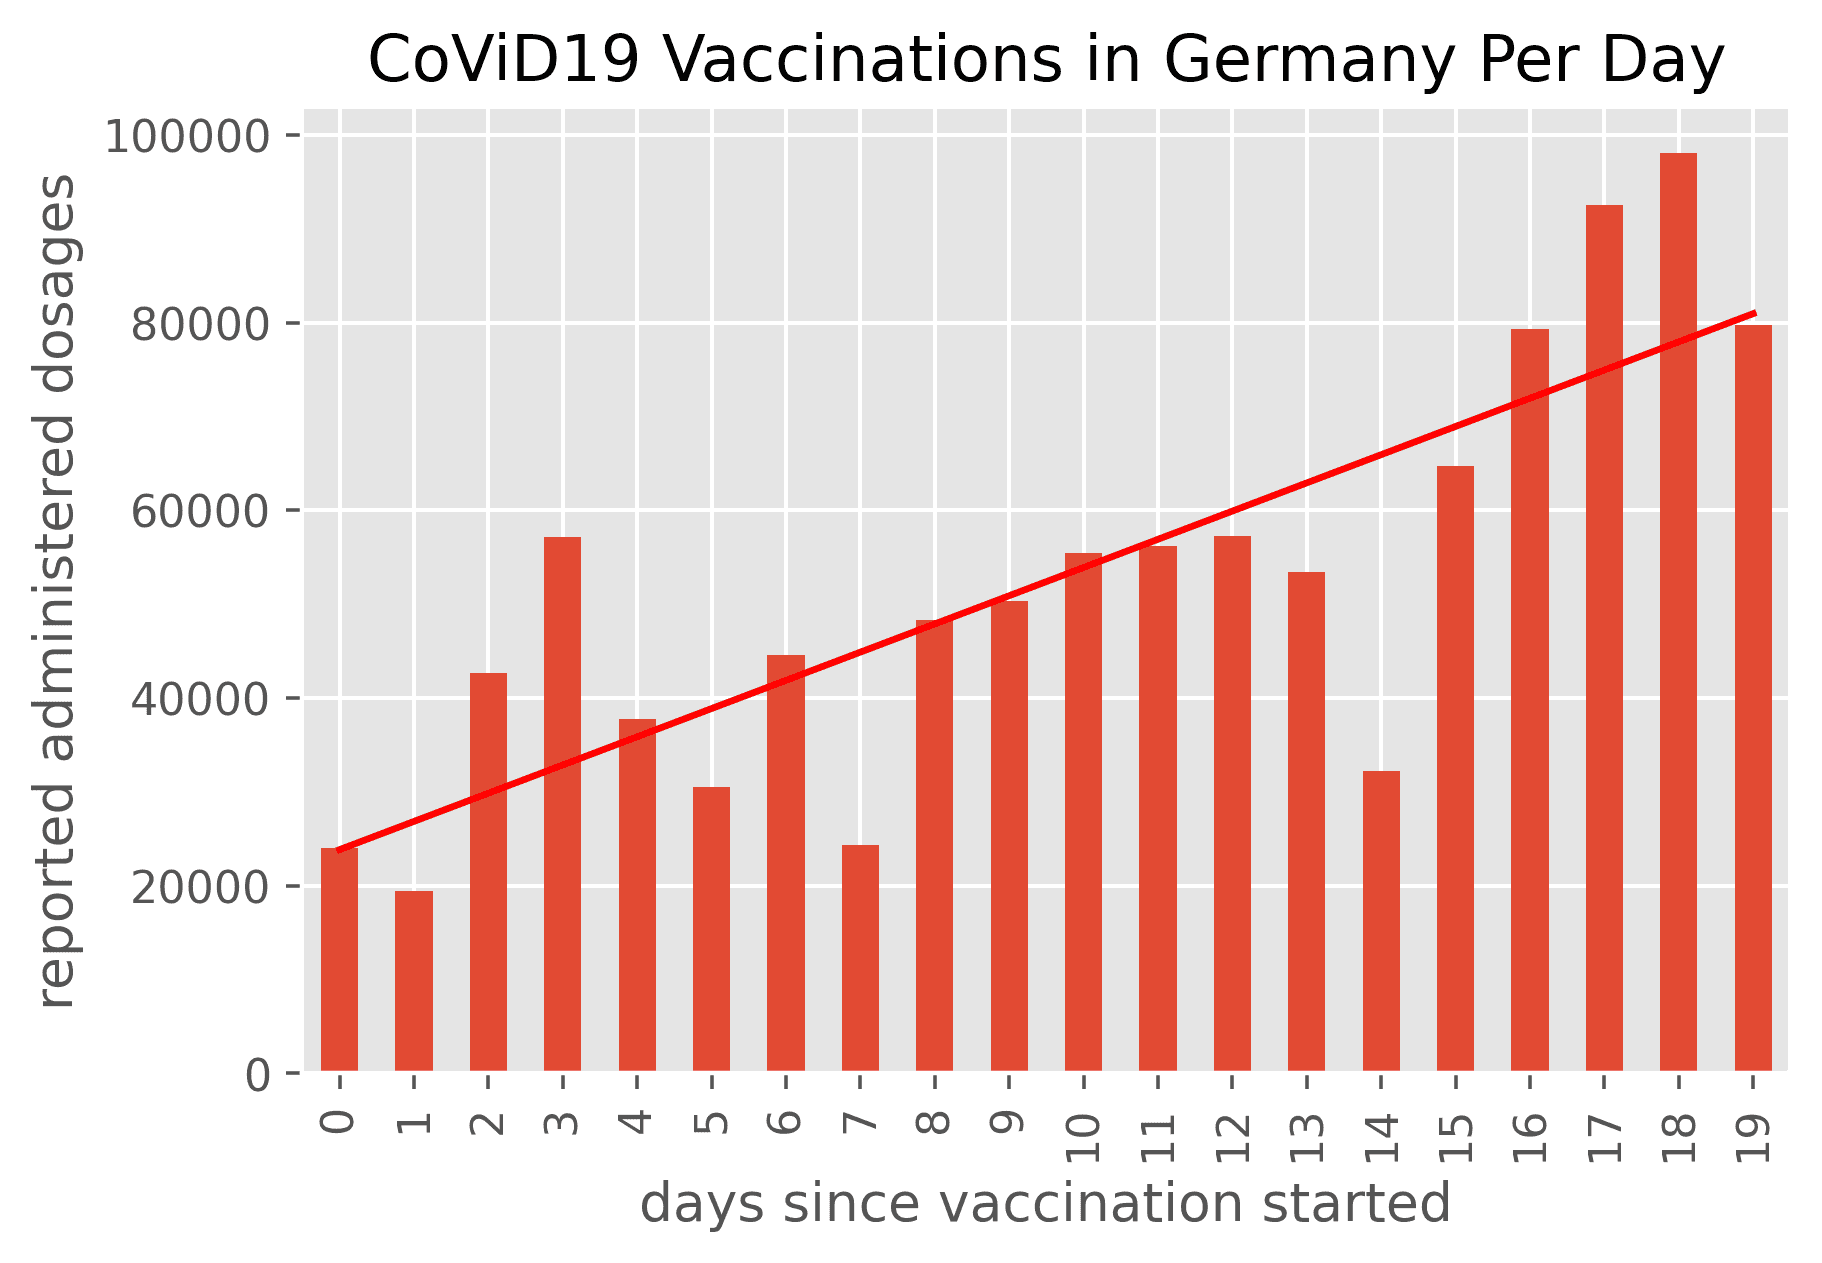
Looks good to me1 - now let's see when the Germans will be vaccinated in a linear scenario. I'll start with a function that returns the cumulative number of vaccinated Germans:
def cumulative_vaccinated_people(x, slope, intercept):
    if x > 0:
        return cumulative_num(x-1, slope, intercept) + slope * x
    elif x == 0:
        return intercept
    else:
        raise ValueError('x >= 0 required')
Next, I write find_days() to brute-force the solution.
def find_days(slope, intercept, vaccine_shots_needed):
    for days_since_vaccination_started in range(300):
        if cumulative_vaccinated_people(days_since_vaccination_started,
                                        slope,
                                        intercept) > vaccine_shots_needed:
            print(f'Hurrah! In the linear scenario, the Germans will be vaccinated in {days_since_vaccination_started} days!')
            break

# Hurrah! In the linear scenario, the Germans will be vaccinated in 273 days!
There are 80.000.000 Germans, ~70% of them need to be vaccinated to achieve herd immunity. That's 56.000.000 Germans that need two shots of the Pfizer / BioNTech vaccine each. In conclusion, at least 112.000.000 vaccine shots are required. From the linear regression, I know that the slope is 3005 dosages/day and that the intercept is 23853 dosages; these are all the parameters that are required to run find_days().
In a linear scenario, the Germans will achieve herd immunity by October 2021. So there it is, a silver lining. I'll cling to it until this winter is over.
-
A side note: If you inspect the plot closely, you can see that it fluctuates periodically. The local minima are in fact Sundays. If you know anything about Germany, you know that all stores are closed on Sundays. In general, we don't work on Sundays.
This is also what medical professionals conducting the tests think, as well as those working in the regional public health bureaus who report the numbers to the Robert Koch Institute. All German statistics on daily recorded CoViD19 infections and deaths look like a roller coaster, but one could say that in Germany, not even the pandemic works on Sundays.↩